PR (UK:*’PR’, ‘Pr’: /ˌpiːˈɑː/)
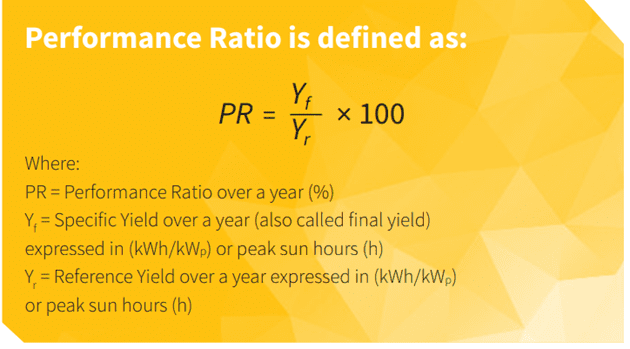
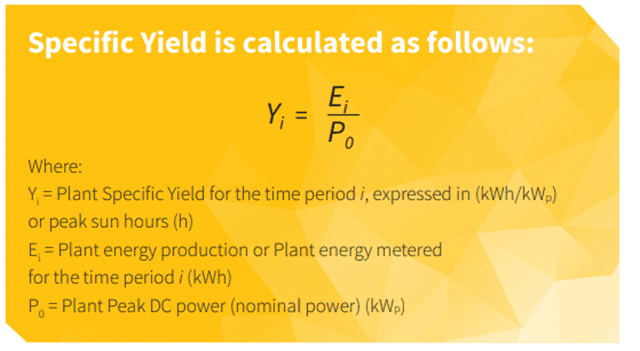
The performance of your power plant is the key indicator to understand the current plant behaviour. The Performance Ratio (PR) [1] is a very common indicator, calculated by the comparison of the current plant behaviour with some theoretically reference energy produced. PR =1 means a theoretically perfect functioning plant, while PR < 1 indicates some losses of the solar system due to real-life effects (module degradation, temperature, soiling, inverter losses, transformer losses, and system and network downtime…).
Where
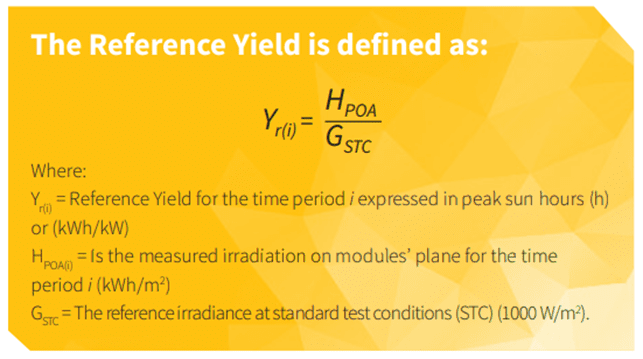
And
Example of usage
The PR is usually used to report on year or month periods of time, and it is usually compared with other similar plants to find out macroscopic differences. You should use data with measurement of 15 minutes.
In pop culture
In Google trend, worldwide search “performance ratio” from 2004 reports just three countries.

The interest over time is quite declining.

- Price – performance ratio
- Photovoltaics – topic
- Solar power – topic
- Calculation – topic
- Formula – topic
- performance ratio solar
- price performance ratio
- ratio analysis
- pr
- iupr
Did you know?
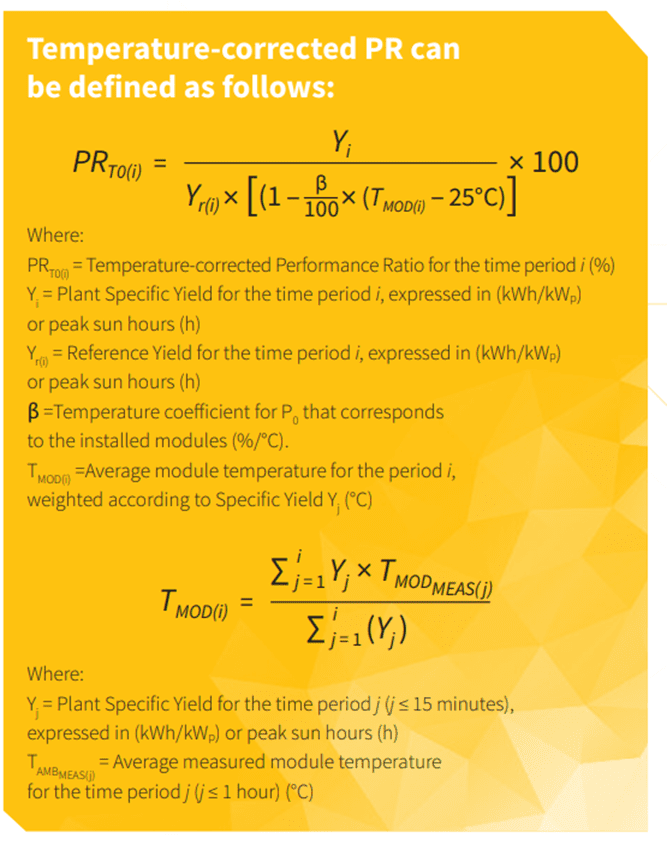
If you need to measure the PR of your plant over short periods of time, say two-four weeks, it is recommended to use a PR formula corrected with a temperature factor in order to neutralise the short-term PR fluctuations related to temperature variations from 25 °C (Standard Test Conditions).
Etymologycal origin
Performance comes from Anglo-French parformer, alteration (by association with forme form) of Middle French, Old French parfournir to accomplish.
Ratio comes directly from latin: Latin ratiō a reckoning, account, calculation, derivative (see -tion) of the base of rērī to judge, think.
Source: WordReference.com
At i-EM
We perform performance KPI calculation for your plant using ground measurement data and satellite-based data. Satellite-based data are especially useful in case of missing data or in general when data measured onsite are not available or not reliable. The longer the period considered, the lower the error will be for satellite-based irradiation data.
Since the solar measurements greatly influence the final KPI value, it is crucial to quantify accuracy and understand the specific characteristics of the instrument used to measure them.

Figure 1: average PR value over Italian regions for the Italian plants monitored by i-EM
Notes
[1] Woyte, Achim, Mauricio Richter, David Moser, Nils Reich, Mike Green, Stefan Mau, and Hans Georg Beyer. 2014. “Analytical Monitoring of Grid-Connected Photovoltaic Systems – Good Practice for Monitoring and Performance analysis.” Report IEA-PVPS T13-03: 2014. IEA PVPS. (See reference)
[2] SolarPower_Europe_OM_Best_Practice_Guidelines_Version_4.0.pdf (See reference)
For the curious costumer
At i-EM S.r.l. we have what you need (we hope!)… Try us!
Author
Fabrizio Ruffini, PhD
Senior Data Scientist at i-EM

